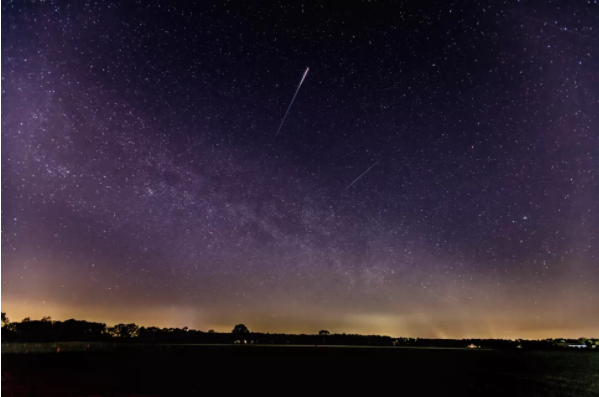
Like any subjective measurement and sometimes taking into account the large number of inexperienced observers who send observation reports to the centralizing body, it is necessary to draw a distribution diagram of the magnitudes specific to each observer in order to be able to make comparisons and detect personal errors.
Estimating magnitudes is often felt by beginners to be a difficult experience and the differences for each observer are clearly shown in the charts of the Dutch Meteor Society.
A beginner finds it difficult to estimate the magnitude of the brightest meteors that are not rated uniformly. It is a normal phenomenon for an inexperienced observer that one finds in the evaluation of variable stars.
The errors become larger and larger as the brightness of meteors increases and exceeds magnitude 0 due to the fact that there are fewer comparison stars. Conversely, novice observers often underestimate very faint meteors. It is a logical error by a very starry sky which leads to give to the population index “r” too high a value (r = 3).
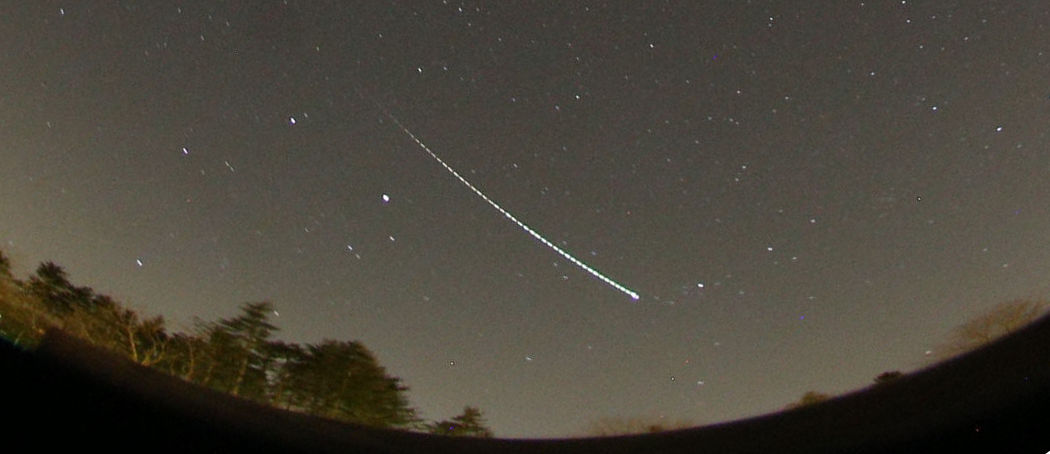
Finally, we can observe breaks between certain magnitudes (between 2 and 4 for example) which are often produced by overly optimistic evaluations of observations made under bad conditions and pessimistic evaluations made under good conditions. This model applies not only to swarms but also to the observation of sporadic meteors.
As a general rule, we can deduce that at least there are meteors for a given magnitude, the greater the ascending line running through the points found. The angle that this straight line forms with the magnitude axis represents the average lumination value for this swarm, conditioned by the factor “r”, the population index. The smaller this factor, the greater the average lumination. This must be taken into account because the more an observer estimates the intense luminosity, the smaller “r” will be. The circumstances of the observation therefore play an important role.
It is important that observers become aware of their “personal equation” in order to deduce the main differences between their own evaluations and the mean and take them into account in their next observations. In the long term, we can also consider attributing to each assiduous and confirmed observer a determined correction factor, like what is done for the study of Transient Lunar Phenomena.
But from this simple graph we cannot yet deduce the individual correction factors. For this, the observer must have noted a large number of meteors during his observation session. In addition, the limiting magnitude per observation station probably plays a disturbing role. An analysis of the factors influencing the estimation of luminosity was undertaken by the British Meteor Society a few years ago (Robert Mackenzie).
4,775 comments
http://cialisvip.com/# Cialis Vip
http://cialisvip.com/# Cialis Vip
https://cialisvip.com/# Tadalafil price
cheapest viagra Sildenafil Vip sildenafil 50 mg price
https://stromectolvip.online/# ivermectin where to buy for humans
Cialis without a doctor prescription cialis for sale cialis for sale
http://sildenafilvip.com/# Sildenafil Vip
sildenafil 50 mg price Sildenafil Vip Viagra generic over the counter
Generic Cialis without a doctor prescription Generic Cialis price Cialis over the counter
Cialis 20mg price Cialis 20mg price in USA Tadalafil Tablet